
Continuous Performance Testing (CPT) with Jagger
In previous blog posts we have described the business need for automated and continuous performance testing, the role and place of continuous performance testing in the continuous delivery pipeline, and the design principles of performance tests. In this article we’ll describe the Grid Dynamics technology for CPT, Jagger, which we developed over the years based on numerous client engagements and have released under the Apache open source license.
1. Overview of Jagger as a CPT platform
A good CPT platform facilitates all common activities related to the lifecycle of performance testing, including:
- Creation of automated performance tests. The process begins with the performance engineering team writing automated performance tests. The CPT platform should be convenient for the test writers and provide tools for testing, debugging, and managing test code.
- Test load generation and management. Once performance tests are written, the team must decide on the required load generation infrastructure. It can range from a simple all-in-one, single-VM configuration to complex distributed, multi-node load generator, executor, and collector configurations.
- Integration with CI/CD pipelines. Once performance tests and load generation configurations are defined, performance tests will be run continuously as a part of CI/CD pipeline. DevOps team need to integrate performance testing with correctly configured test environments and CI/CD tools.
- Analysis and visualization of test results. Once performance tests are deployed as a part of the CI/CD pipeline, they are executed continuously on all new builds and release candidates. The results of the tests are collected and stored; then analyzed, visualized, and used to make further decisions about the release readiness of that particular build relative to performance requirements.
In the following sections we’ll describe how Jagger supports these activities. It is an open source project that we are using in a number of client engagements to implement continuous performance testing. For a shortcut, you can download Jagger and read more about it on our website on GitHub.
There are some things Jagger doesn’t do internally in the platform that must be addressed separately. Two of the most important ones are:
- Test data management - performance of applications usually depends on data, and could significantly change. During performance testing we have to focus on next areas of data management: getting fresh production like data, generating synthetic data for new functionality and masking security information.
- Environment management - continuous test execution, repeatable test results, run tests on demand - all these thing can exist only if we have well-defined environment management. Automated provisioning VMs, deploying applications, monitoring system status; these elements would allow us to build a continuous process.
While we would love to bring these capabilities to Jagger in the future, they are not part of the technology today.
Jagger core concepts
- Endpoint - where we are applying load. In case of http protocol, it can be URI
- Endpoint provider - source of the test data (endpoints)
- Query - what parameters we are sending
- Query provider - source of the test data (queries)
- Distributor - component, responsible to combine endpoints and queries in different order (one by one, round robin, unique combinations, etc)
- Invoker - component, providing requests to system under test during load test. In case of http protocol - http client
- Validator - component that verifies responses from SUT - decides if response is valid or not. In case of http we can verify that return codes are always 200
- Metric - component that measures some parameter of the response (response time, throughput, success rate of requests, custom parameters)
Architecture overview
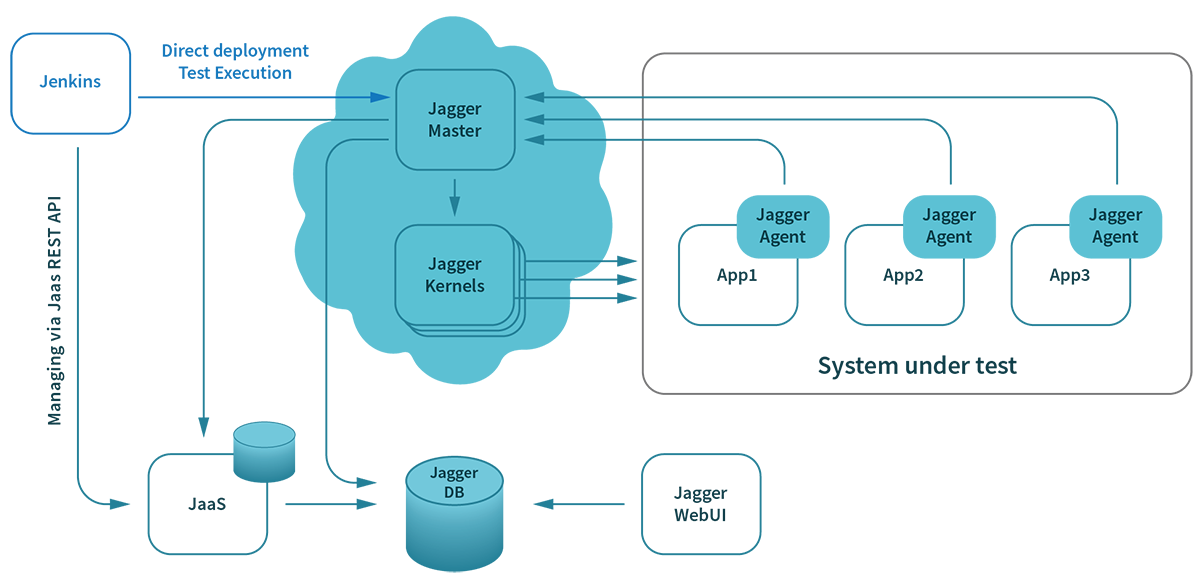
The main function of Jagger is executed by the Jagger Master, which coordinates the Kernels’ work on load generation for the system under test. These components are running on separate cloud environments and can be scaled by adding new kernels to the cluster and providing sufficient load.
Kernels collect basic performance metrics (response time, throughput, etc.), and for additional information we inject Jagger Agents into the application in SUT. Each agent provides system and application metrics to the Jagger Master, which stores all data in the database.
For analysis and visualization we use the Jagger WebUI.
Jagger can be managed in two ways:
- Jagger Jenkins plugin - which lets us deploy the Master and Kernels, execute tests, and store all results.
- Jagger as a Service - where we can manage same things via REST API.
2. Creation of automated performance tests
Jagger is designed to make writing and running performance tests easy for developers. The tests are written in plain Java using Jagger DSL. Using plain Java for test project gives you the ability to add any Java library for describing endpoints and manage test data.
Developers can run the tests locally on their machine while they are developing them, before they are ready to be “released” as part of the CI/CD pipeline.
- In general, all Jagger components for local installation can be separated into:
- Results storage, representation, and management components
- Load generating components
- To install and launch results storage, presentation and management components you can use docker. Download docker and compose a .yml file for local installation; compose-2.0-package.zip from https://nexus.griddynamics.net/nexus/content/repositories/jagger-releases/com/griddynamics/jagger/compose/2.0/ and unzip it. Run docker compose. All necessary images will be downloaded from the DockerHub and launched locally in containers
docker-compose -f docker-compose.yml up - For load generation you need to create a new Java project. In order to create performance tests in Jagger, you first need to create a project. This can be accomplished using a Maven archetype:
mvn archetype:generate
-DarchetypeGroupId=com.griddynamics.jagger
-DarchetypeArtifactId=jagger-archetype-java-builders
-DarchetypeVersion=2.0
-DarchetypeRepository=https://nexus.griddynamics.net/nexus/content/repositories/jagger-releases/
You are now ready to start writing and executing performance tests.
Create new tests
- Add a new test. Creation of a new test in Jagger starts with the Test Definition, which defines test endpoints, test queries, and validations of responses and metrics.
- Add the newly-created test definition to Load Test, where you define the load profile, and how and when it will be terminated.
- Take it to the next level by adding a Parallel Test Group, where you can group tests to be executed in parallel. For example, if you want to check the performance of search functionality during indexing and data updates, you must run these activities in parallel.
- Finally, add test groups to the Load Scenario, which contains the list of test groups that will then be executed consecutively.
- Start the load scenario
- Start the first parallel test group inside the scenario
- Start all load tests inside the test group
- Provide SUT invocations (send requests to the SUT, work with the responses)
- Stop all the tests
- Stop the first test group
- Start the second test group
- …
- Stop the second test group
- Start the first parallel test group inside the scenario
- Stop the scenario
Supported protocols
Out of the box, Jagger supports HTTP and HTTPS protocols for load tests. While it is possible to create your own end points and add support for other protocols, it is a rather advanced feature which we will not cover in detail in this blog post. For other endpoints you can use classes as an example and create your own Test Definitions. For examples on how to create your own Test Definitions and more, please look at the Jagger documentation.
Define complex test scenarios
CPT framework has to offer rather sophisticated user scenario tests, similar to a sequence of user actions on an e-commerce website. Some example of actions in this kind of test case include:
- Create a new user and log in
- Perform site browsing and search
- Add items to a shopping cart
- Perform checkout, payment, and shipping
For proper performance metrics collection, Jagger will measure the response time of every UI action and API call, and the duration of complete steps in our user scenarios. This allows Jagger to check scenario step duration vs. acceptance criteria, as well as review the impact of every action and call.
Jagger supports creating user scenarios and validating responses after each step and generating next step queries based on predefined context and system responses. This helps simulate complex behavior in test cases. More details can be found in the documentation here.
Managing test code
Performance tests are regularly stored as separate projects in the version control system, and they have to follow the same rules for versioning, branching and release cycle as the SUT. If we break this rule, we could create a lot of issues such as testing incompatibility and instability, which would cause false alarms and reduce the accuracy of the test results.
Another thing which we need to think about when determining the scope of versioning is the test data. From release to release, new features are going to come — and we need to support them by creating new test data for them.
3. Test load generation and management
Once the tests have been written, it is time to generate a load for the System Under Test. Jagger helps do this efficiently. Depending on the test requirements, the load generation can work in a variety of topologies.
Simple, single-VM configuration
In the simplest configuration, test load generation is performed within one JVM. The results are stored in In-memory DB and a pdf test report is generated at the end. In this configuration you can collect only standard performance metrics.

Jagger-as-a-Service (JaaS)
While this configuration is convenient for quick local debugging of the tests under development, it is limited in its capabilities and is not a recommended way to use Jagger. The default configuration of Jagger deployment provides a more robust functionality:
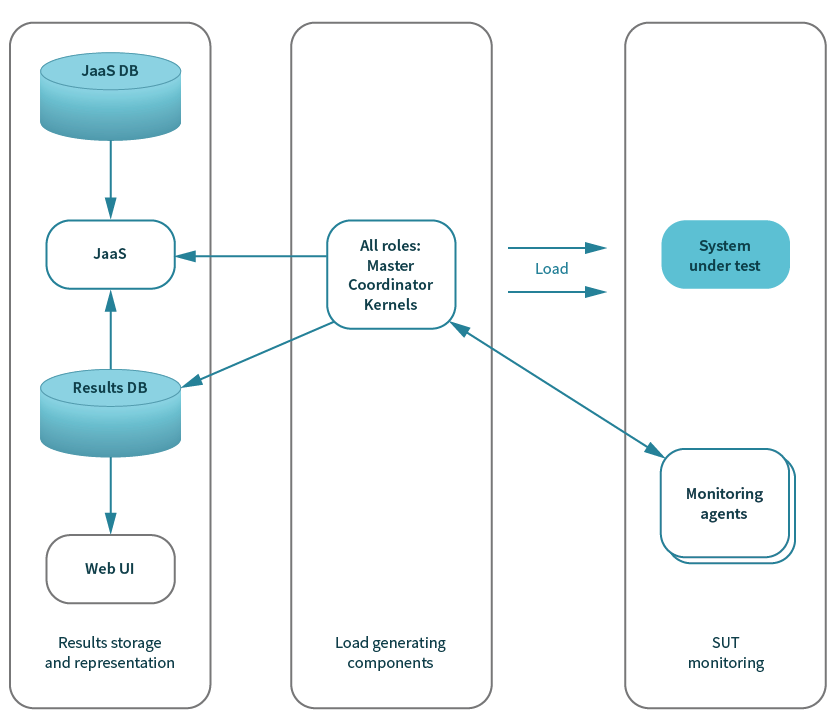
All load management and generation is still done from single JVM, however:
- Results storage and representation components are deployed in docker containers
- JaaS has a REST API
- Monitoring agents are separate processes that collect system and JVM metrics
Distributed load generation
In a case where a single node is not able to generate enough load or you would like to load your system from different nodes/locations, you can run the Jagger framework in the distributed mode.
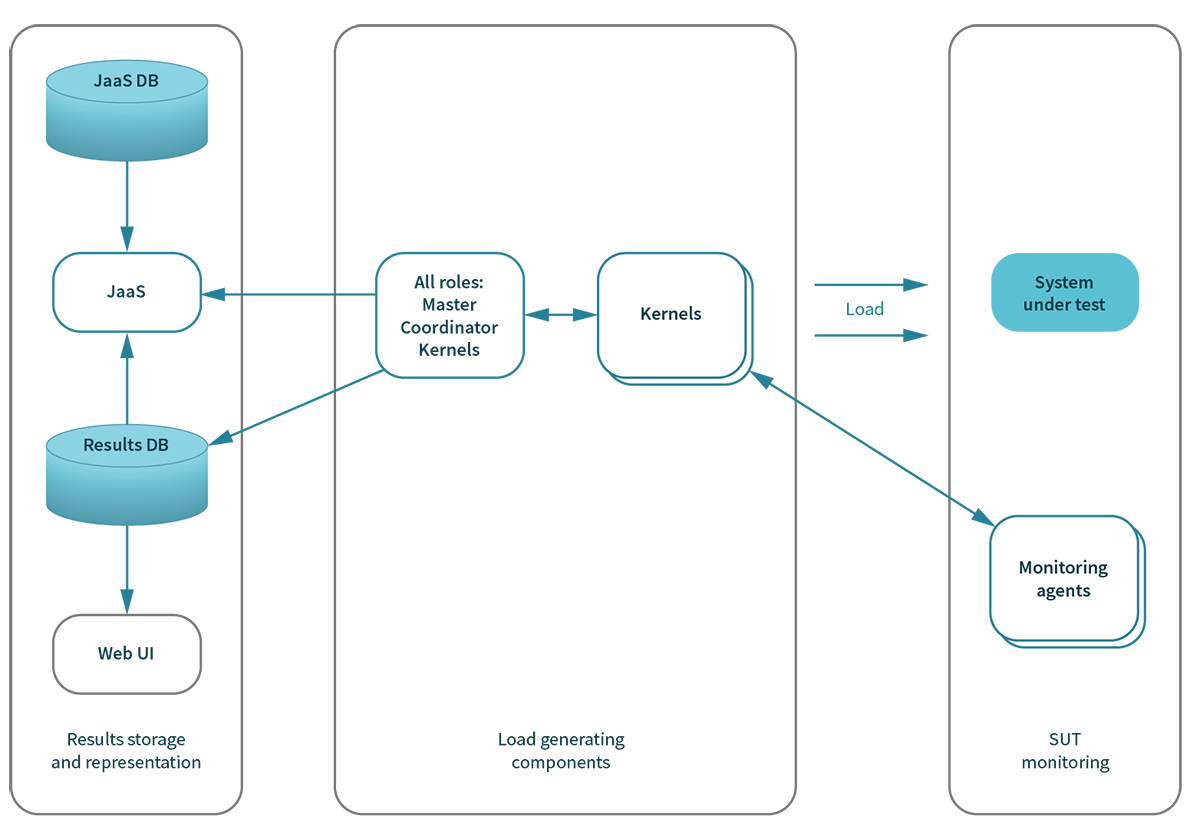
In distributed mode, load generators (Kernels) are started as separate Java applications on single or multiple nodes. Kernels are responsible for communication with the SUT, with monitoring agents, and for temporary storage of raw test results.
The Master/Coordinator is started in its own JVM and is responsible for load balancing between Kernels, communication with JaaS, final results aggregation, and storage in the results DB.
Collecting metrics and storing results
An essential part of every CPT solution is collecting metrics from the SUT during test runs. There are several types of metrics:
- Standard performance metrics (Throughput, Response time, etc.)
- System metrics (CPU, Memory, Network, I/O and etc.)
- Application metrics (e.g. JVM metrics)
- Results of functional response verification during performance tests
- Custom metrics, based on SUT responses or external tools
The Jagger CPT platform has the ability to store all these metrics and use them for making decisions based on defined limits or deviations from previously measured values. (More info here.)
Metrics collected from a single execution can provide a lot of helpful information, but this is not where Jagger shines. To meet the objectives of CPT such as production validation, performance stability, and capacity planning, we need to collect and compare results from multiple executions. When we have an initial baseline, the trend of how the system’s performance metrics are evolving over time is more important than a single result. This allows us to run continuous performance testing in smaller environments and compare the results to production so we can better understand whether the system performs well or not. We can compare results of the tests in a smaller “lab” environment with themselves and each other and use correlation models between lab and production to evaluate production behavior.
In order to do that, Jagger stores test results and uses them for the following purposes:
- Baseline reporting and decision making
- Test reporting
- Trend analytics
- Production issue investigation
Collecting, storing, and comparing metrics is a typical performance testing tool feature set. But when setting up CPT, we also require automated decision making based on both standard and calculated metrics. This mechanism must be flexible and customizable in order to control and trigger based on metrics specific to our application.
4. Integration of Jagger with CI/CD pipelines
Now that we are ready to execute performance testing automatically, it is time to integrate Jagger into the CI/CD pipeline. Since Jenkins is the most popular CI server out of the box, Jagger comes with two Jenkins integration plug-ins:
- Jagger deployment plugin: deploys Jagger to a specified environment, executes tests, and stores results. Allows configuration of Jagger without scripting.
- Jagger JaaS plugin: controls test execution on the performance test environment(s) via JaaS REST API. It allows submission of test projects to the running test environment with Jagger load generating components.
In case you use another CI server, you can still integrate it with Jagger via the REST API. JaaS provides a REST API with 4 main controllers:
- test-execution-rest-controller: Jagger Test Execution API. It provides endpoints for reading, creating, updating and deleting Test Executions. This API can be used manually or via a separate Jenkins plugin, to run particular performance test projects on the selected test environment
- test-environment-rest-controller: Jagger Test Environments API. It provides endpoints for reading, creating and updating Test Environments. Deleting is performed automatically. Expiration time of environments is set by property 'environments.ttl.minutes.' This API is user by Jagger load generation components for communication with JaaS. It allows JaaS to monitor running test environments and send commands to these environments. Test Environments API is not intended for manual usage
- reporting-rest-controller: Jagger Reporting API. It provides an endpoint for generating reports based on sessionID and baseline session.
- data-service-rest-controller: Jagger Data Service API. It provides an endpoint for reading all details of test results, including metrics, trends, and comparison.
5. Analytics & visualization of test results
The analytics part of the CPT platform has to cover two main use cases:
- Automatic analysis and decision making
- Manual analysis and support for investigating the root cause of an issue
Automatic analysis
Without automatic decision making we can’t build a true continuous process. Based on predefined thresholds and baseline results, our engine has to fail fast and reduce costs for investigating performance issues.
First we need a Jagger support baseline and comparison with its results. You could easily execute your test suite in a CPT environment with a “well performing” application version to establish the baseline, then use its results for comparison.
Also, for each metric you can set up warning and error limits for comparison with a baseline.

A baseline build is established as a reference point and new build results are compared with the baseline.
Results analysis:
- Pass when value is in range (Lower Warning Threshold*ref .. Upper Warning Threshold*ref)
- Warning when value is in range (Lower Error Threshold*ref .. Lower Warning Threshold*ref) OR (Upper Warning Threshold*ref .. Upper Error Threshold*ref)
- Error when value is less than Lower Error Threshold*ref OR is greater than Upper Error Threshold*ref
Note that we want to fail tests and receive alerts not only when performance degrades, but also when it improves abnormally. In a way, Jagger automatically performs anomaly analysis on the system’s performance metrics.
Jagger also highlights threshold violations via its Web UI:

Manual analysis
After detecting performance issues we need to find their root cause. In the WebUI we have a visualization which can help.
Building trends for comparison between test sessions.
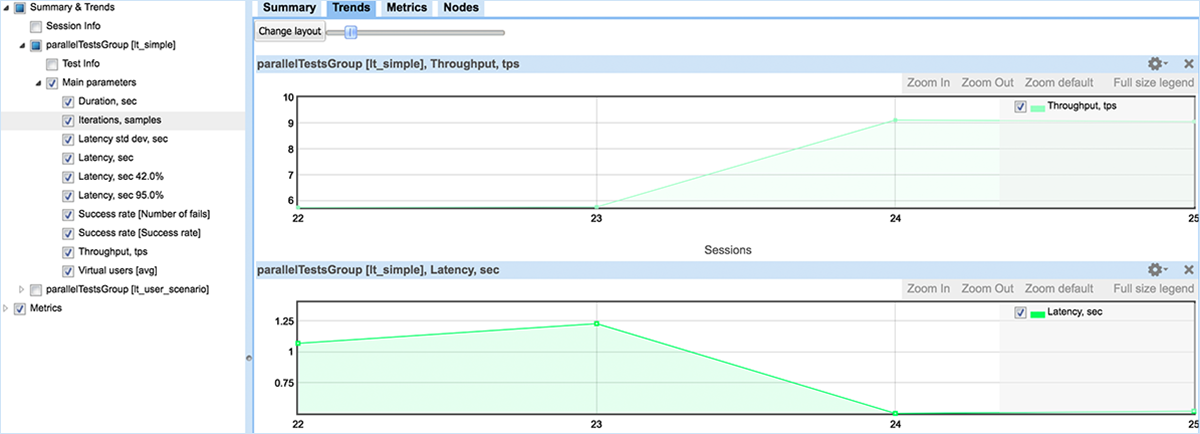
Metric details during test execution
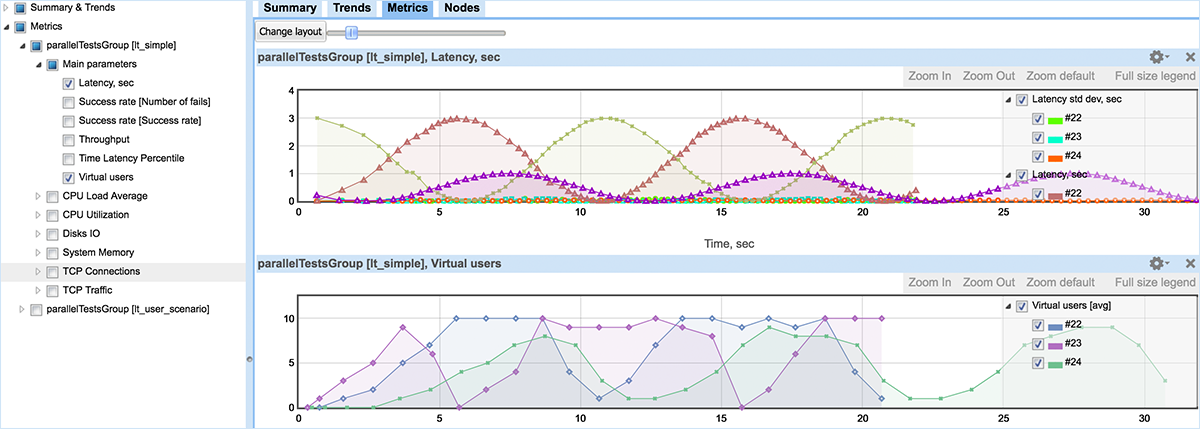
Also, all information about test nodes is stored in a data base and can be shown on the UI.
Implementing CPT gives us another great ability: the automation of all parts of the environment provisioning, deployment, test execution, and results storage. Now we have a way to reproduce results on demand, with the ability to add instruments such as profilers and other external tools to our test run. Our smoke and integration performance tests are executed regularly and often, so we generate a large amount of test results. To make those results easy to interpret, our CPT platform visualization tool follows these principles:
- Report early, report often
- Report visually
- Report intuitively
- Use the right statistics
- Consolidate data correctly
- Summarize data effectively
- Customize reports for their intended audiences
- Use concise verbal summaries
- Make the data available
The CPT platform visualization tool provides:
- Detailed comparisons of multiple test runs
- Highlighting of detected and potential issues
- Visualization of metrics collected during test runs (spikes, ramps)
- The ability to share results and export custom reports (for engineers, for management, for stakeholders)
Conclusion
In this post we have defined the main features required for the CPT Platform, and described how Jagger implements these features. As an open source platform available under the Apache 2.0 license, Jagger is freely available. Give it a try today, and feel free to reach out to us with any questions.

