
High-performance Join in Solr with BlockJoinQuery
Join support is a highly-requested Solr feature, especially in e-commerce. So I repeated Erick Erickson’s benchmark test with block join support for Solr, and I want to share my observations on how BlockJoinQuery can maximize Solr/Lucene performance.
Definitions
In this post and in the future, let’s distinguish between Join and BlockJoin. Most of the technical details are covered in this talk by Martijn van Groningen.
Data
I have a single-segment 55 GBindex with 27 M docs -- about a million parent documents, each with five children. I ran the worst case scenario from Erick’s benchmark, where the Join field has many unique values. It’s a worst case scenario for Join, but not for BlockJoin.
Tools and procedure
I used SolrMeter with a slightly modified RandomExecutor, which tries to keep a specified rate of queries per time period. I prefer this constant-throughput model, rather than a virtual user’s model, because SolrMeter allows us to gently ramp up load and empirically find the saturation point. It also provides several useful statistics and charts.
In addition, I attached iostat traces to show system load during tests.
I have a 2.4 GHz Core i5 laptop with 8GB RAM and a good old 5400 rpm HDD onboard.
Query Result Cache and Filter Cache have been disabled. Document Cache is enabled and shows a hit ratio of about 0.5. See more about these Solr bolts and nuts.
My goal is to find the maximum throughput that doesn’t impact search latency.
Join
A Solr Join Query looks like:
q=text_all:(patient OR autumn OR helen)&fl=id,score&sort=score desc&fq={!join from=join_id to=id}acl:[1303 TO 1309]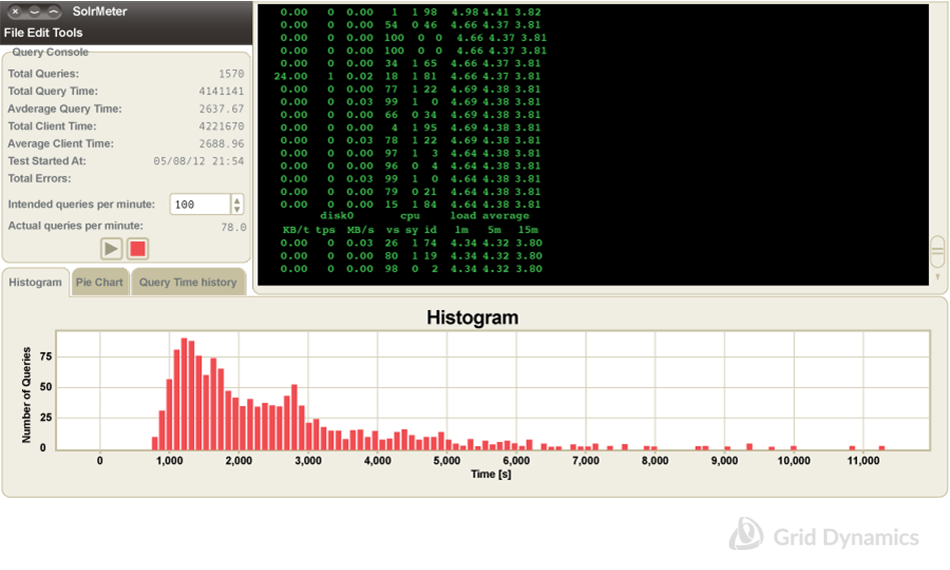
I did several measurements and decided to post this particular histogram (caveat, it’s not a timeline). You can see that Join almost never ran for less than a second, and the CPU saturated with 100 requests per minute. Adding more queries harmed latency.
From iostat trace you can see that there was no I/O activity. All index was cached in RAM via memory mapped files magic. (I’ll talk about that later.)
BlockJoin
I used Sen for the same queries with blockjoin.
q=text_all:(patient OR autumn OR helen)&fl=id,score&sort=score desc&fq={!parent which=kind:body}acl:[1303 TO 1309]Here is the latency timeline along with some statistics.
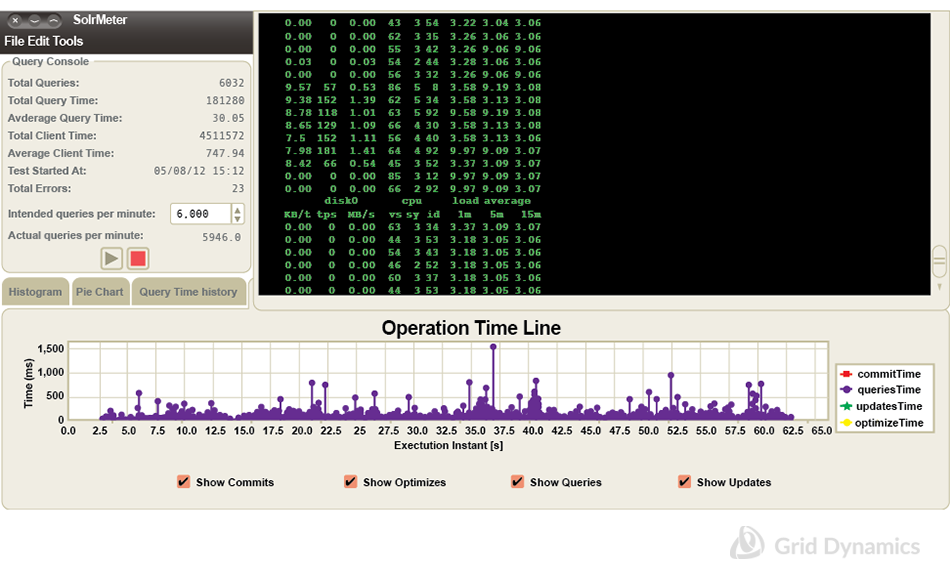
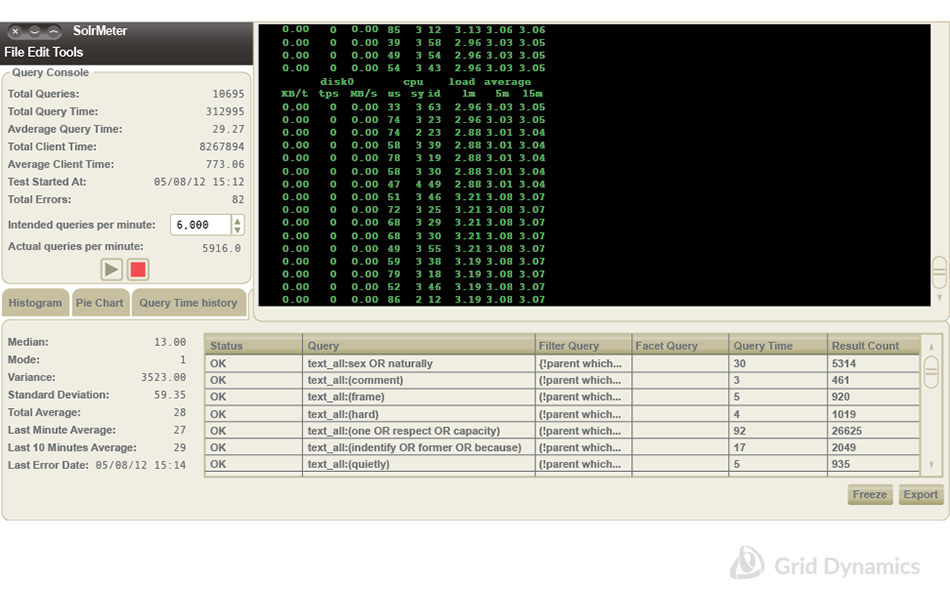
You see it! Search now takes only a few tens of milliseconds and survives with 6K requests per minute (100 qps). And you see plenty of free CPU!
Culprit
We can check where Join uses so much CPU power with jstack:
java.lang.Thread.State: RUNNABLE
 at
 o.a.l.codecs.BlockTreeTermsReader$FieldReader$SegmentTermsEnum.docFreq(BlockTreeTermsReader.java:2098)
 at
 o.a.s.search.JoinQuery$JoinQueryWeight.getDocSet(JoinQParserPlugin.java:338)
I/O exercises
The last screenshot shows a zero I/O rate. How could that be? I ran two tests to understand how cache index files impact performance. You can consider this a lab exercise for the great lecture, Use Lucene’s MMapDirectory on 64bit platforms, please!
First of all, let’s explain how a 55GB index can ever be cached in just 8GB RAM. You should know that not all files in your index are equally valuable. (In other words, tune your schema wisely.) In my index the frq file is 7.7GB and the tim file is only 427MB, and it’s almost all that’s needed for these queries. Of course, a file which stores primary key values is also read, but it doesn’t seem significant.
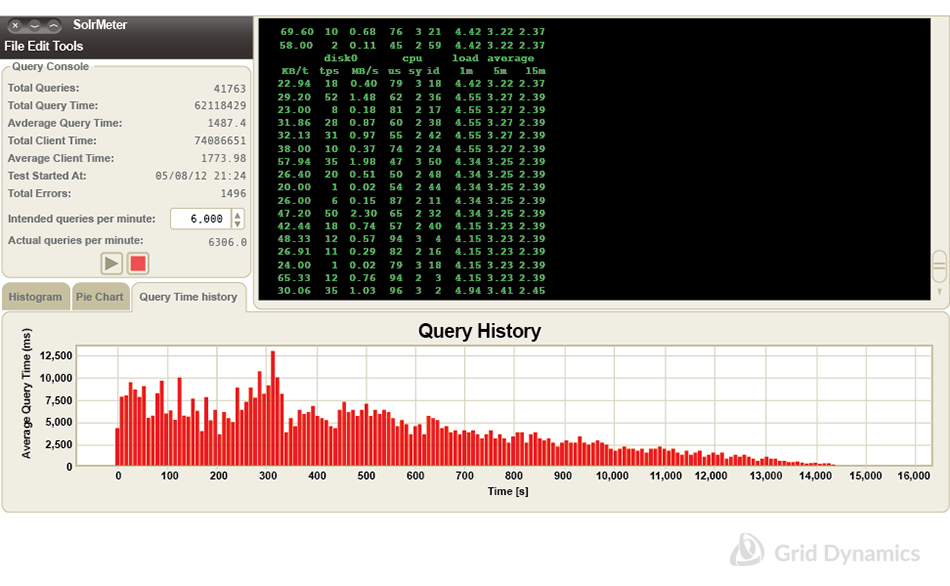
Here is the search latency timeline taken after flushing the filesystem cache with 50 threads configured in a servlet container. Right after the flush, search takes more than seven seconds.
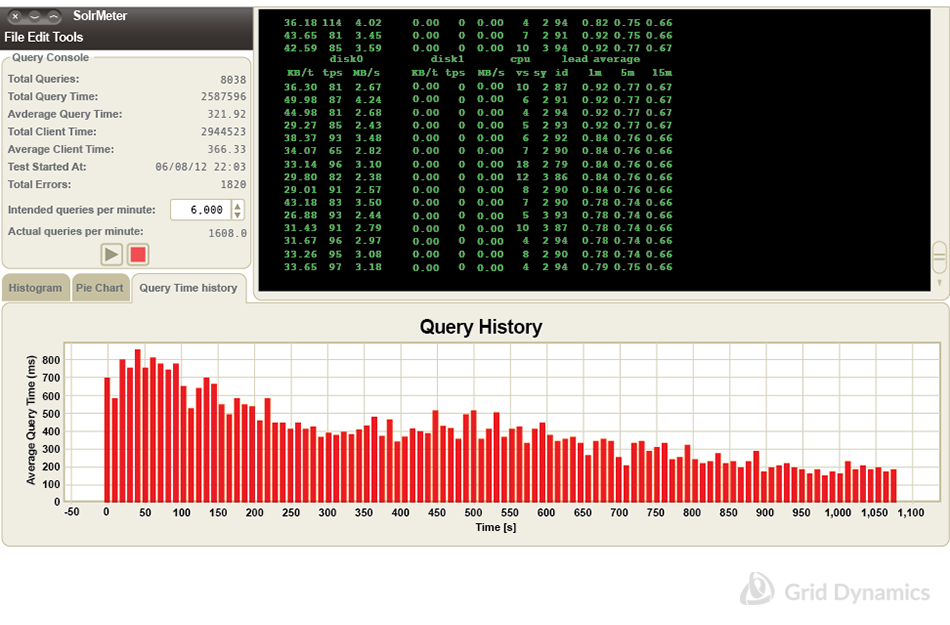
This timeline shows how search time decreases as the cache gets warmed, but it’s shown here with a four-thread limit in the servlet container. All searches are sub-second. Although a four-thread server isn’t able to reach 6K requests per minute due to the “idle” limit, it speeds up much faster than a 50-thread server with an I/O bottleneck.
Our I/O numbers say that we hit the HDD limit. My “lab machine” usually shows 100-200 tps (I/O transactions per second), but I even saw 300 once. The first and third columns: KB/t - kilobytes per transaction and MB/s - IO throughput show how efficiently it reads. To get peak numbers, run cat * >/dev/null in the folder with your index files, and check iostat while it sequentially reads.
One more interesting observation is related to KB/t. My first tests showed really slow search and low I/O utilization; about four KB/t. I was really upset until I realized that in my OS, which is not Linux, FSDirectory chooses NIOFSDirectory. After I explicitly specified MMapDirectory, in accordance with Uwe Schindler’s advice, cache magic started working for me and I got the great result above.
To block or not to block (join)?
From my point of view, BlockJoin is the most efficient way to do the join operation, but it doesn’t mean you need to get rid of your solution based on the other (slow) Join. The place for Join is frequent child updates -- and small indexes, of course.
Updated for republication July 2016, written by Mikhail Khludnev
Mikhail Khludnev holds an engineering degree from Russia's Far Eastern Federal University. He started his career working with complex spatial analysis and geodetic software. Now, at Grid Dynamics, he specializes in e-commerce and Solr search, and has worked on a number of Solr migration projects for world-class retailers.
Mikhail Khludnev
