
Will “Database as a Service” work for retail inventory management? A case study
A global retail company faced the challenge of bringing their inventory management system to the cloud. The company required their new cloud-based solution to include online and store inventory in all geographical regions, and deliver a fast and consistent database performance within each region. The company invited Grid Dynamics to make an evaluation of cloud databases-as-a-service solutions (DBaaS) for the critical inventory storage system due to their expertise in building inventory management systems.
We looked at three fully-managed database services to determine their suitability as retail inventory management systems for global enterprise companies: Amazon DynamoDB, Google Cloud Spanner and Microsoft Azure Cosmos DB. Each of these products offer high availability (at least 99.99% uptime), horizontal scalability, multi-region deployments, multiple consistency models and a rich feature set. Our goal was to evaluate data modeling, integration and performance capabilities in both single- and multi-region deployments. This article summarizes our observations and the lessons we learned from these implementation and performance comparisons.
Our inventory management evaluation test uses a simplified model in a controlled environment. We limited the test to three queries which are frequently used in a typical production environment:
- Inventory quantity: this is the most frequently queried scenario. The available item quantity is checked using the identifier (SKU) and location (store, warehouse, online etc.). The database performs only “read” operations to satisfy this request.
- Replenish items: this scenario adds items to the SKU quantity field in the given location. The database performs a “write” operation, which increases the item quantity field by the given amount.
- Reserve items: this scenario adds items to a shopping cart for later checkout. The reservation is made by subtracting the amount of items from the inventory field by SKU and location. Reserve Items must first check if enough items are currently in inventory by first performing Inventory quantity. If there is a sufficient quantity, Reserve Item proceeds. Reserve Items consists of a “read” operation, followed by a conditional “write” operation.
In order to implement the scenarios listed above, we used a simple data model of one database table. This also allowed us to test concurrent read/write access to the same items.
Here is a representation of the table used in the evaluation:
CREATE TABLE Inventory (
            storeId INT NOT NULL,
            skuId INT NOT NULL,
            inventoryCount INT NOT NULL,
            reservedCount INT NOT NULL
          ) PRIMARY KEY(storeId, skuId)
The evaluation included:
- Development of a tiny Spring Boot application that exposed a REST endpoint for each use case
- Development of load tests using JMeter and Terraform scripts for deployment of the database
- Application in the given cloud, populating synthetic data into the database, running the load test scenarios and capturing metrics
There were two load test scenarios:
- A sequential test, which executes test cases one-by-one in the given number of loops in the following sequence:
- Reserve items
- Replenish items
- Inventory quantity
- A parallel test, which executes test cases in parallel in the given number of loops.
Each test was executed where the application interacts with the primary database instance in the same region, and the fallback case where the application interacts with the database replica in a different region (we chose regions geographically close to each other).
Google Cloud Spanner evaluation
Cloud Spanner is a fully managed, mission-critical, relational database service that offers global transactional consistency, schemas, SQL (ANSI 2011 with extensions), and automatic, synchronous replication for high availability. The service allows running a database in a single region (US, Europe or Pacific Asia) with inter-region replicas for availability, or in multiple regions (2 configurations in US, 1 in Europe and 1 covers three continents). Multi-region setup increases availability from 99.99% to 99.999% and offers read-write replicas in several geographic regions, for an additional cost.
The resource provisioning model in Cloud Spanner is defined in terms of nodes. When a database instance is created, the user allocates a certain number of nodes which share partitioned data and handle the load. Google recommends running at least 3 nodes for production deployments. There is no auto-scaling feature, but the number of nodes per database instance can be changed after launch.
Although Cloud Spanner is a relational SQL-compliant database, its distributed nature impacts schema design. Google outlined some best practices in designing primary keys and indexes to prevent hotspots, which is connected with how data is organized and distributed between database servers.
The integration at the application level was implemented via Cloud Spanner native Java driver (com.google.cloud:google-cloud-spanner:1.5.0) with read-only and read-write transactions. Neither application nor JMeter nodes were the bottleneck during these tests.
In our single-region test we used the environment configuration:
| Database | 3 nodes (us-east-1) 1,000,000 items (100 stores, 10,000 SKUs) Cost: 3 x $0.90 per hour + $0.30 per GB/month |
| Application cluster | 1 x n1-standard-16 (us-east-1) |
| JMeter cluster | 1 x n1-standard-4 (us-east-1) |
| JMeter configuration | 10,000 loops per test case |
The observed performance testing metrics looked like this:
| Single region (us-east-1) | ||||
|---|---|---|---|---|
| Sequential (17 threads) |
Parallel (17 threads) |
Sequential (50 threads) |
Parallel (50 threads) |
|
| Inventory quantity (read use-case) |
TPS: 3010 Avg: 5.46 (3..145) p95: 7.00 |
TPS: 1893 Avg: 8.81 (3..140) p95: 24.00 |
TPS: 7357 Avg: 6.62 (2..163) p95: 10.00 |
TPS: 3263 Avg: 15.04 (3..175) p95: 38.00 |
| Replenish items (write use-case) |
TPS: 1012 Avg: 16.6 (10..167) p95: 19.00 |
TPS: 800 Avg: 21.06 (10..173) p95: 22.00 |
TPS: 1755 Avg: 28.17 (13..1527) p95: 34.00 |
TPS: 865 Avg: 57.42 (13..3674) p95: 55.00 |
| Reserve items (conditional write use-case) |
TPS: 914 Avg: 18.41 (9..204) p95: 21.00 |
TPS: 800 Avg: 21.06 (10..172) p95: 22.00 |
TPS: 1516 Avg: 32.68 (12..1513) p95: 36.00 |
TPS: 864 Avg: 57.44 (12..3678) p95: 55.00 |
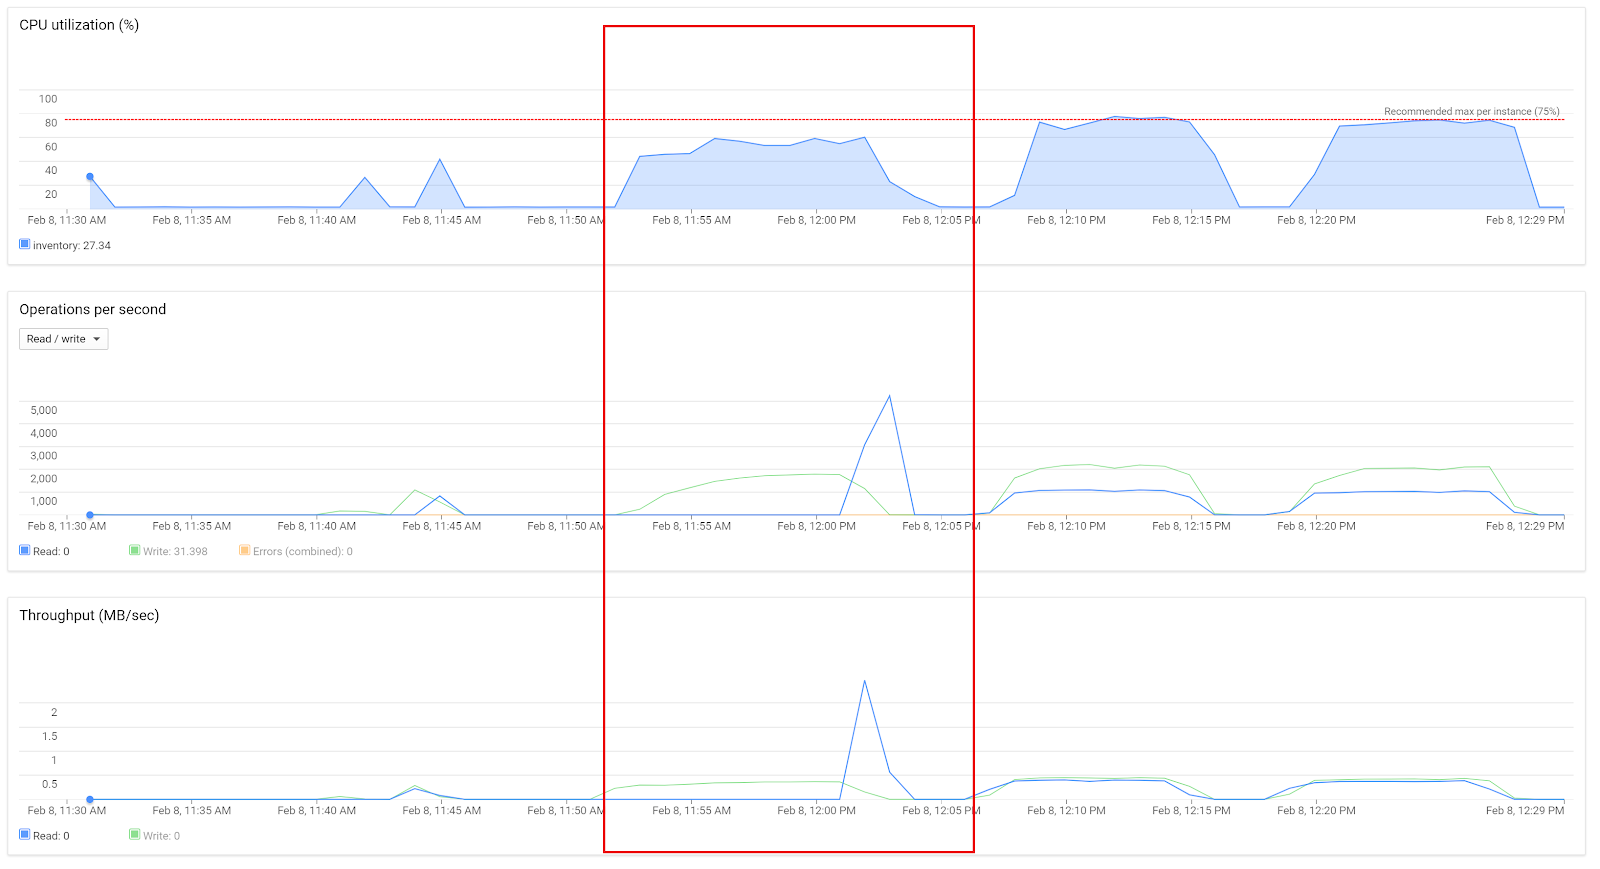
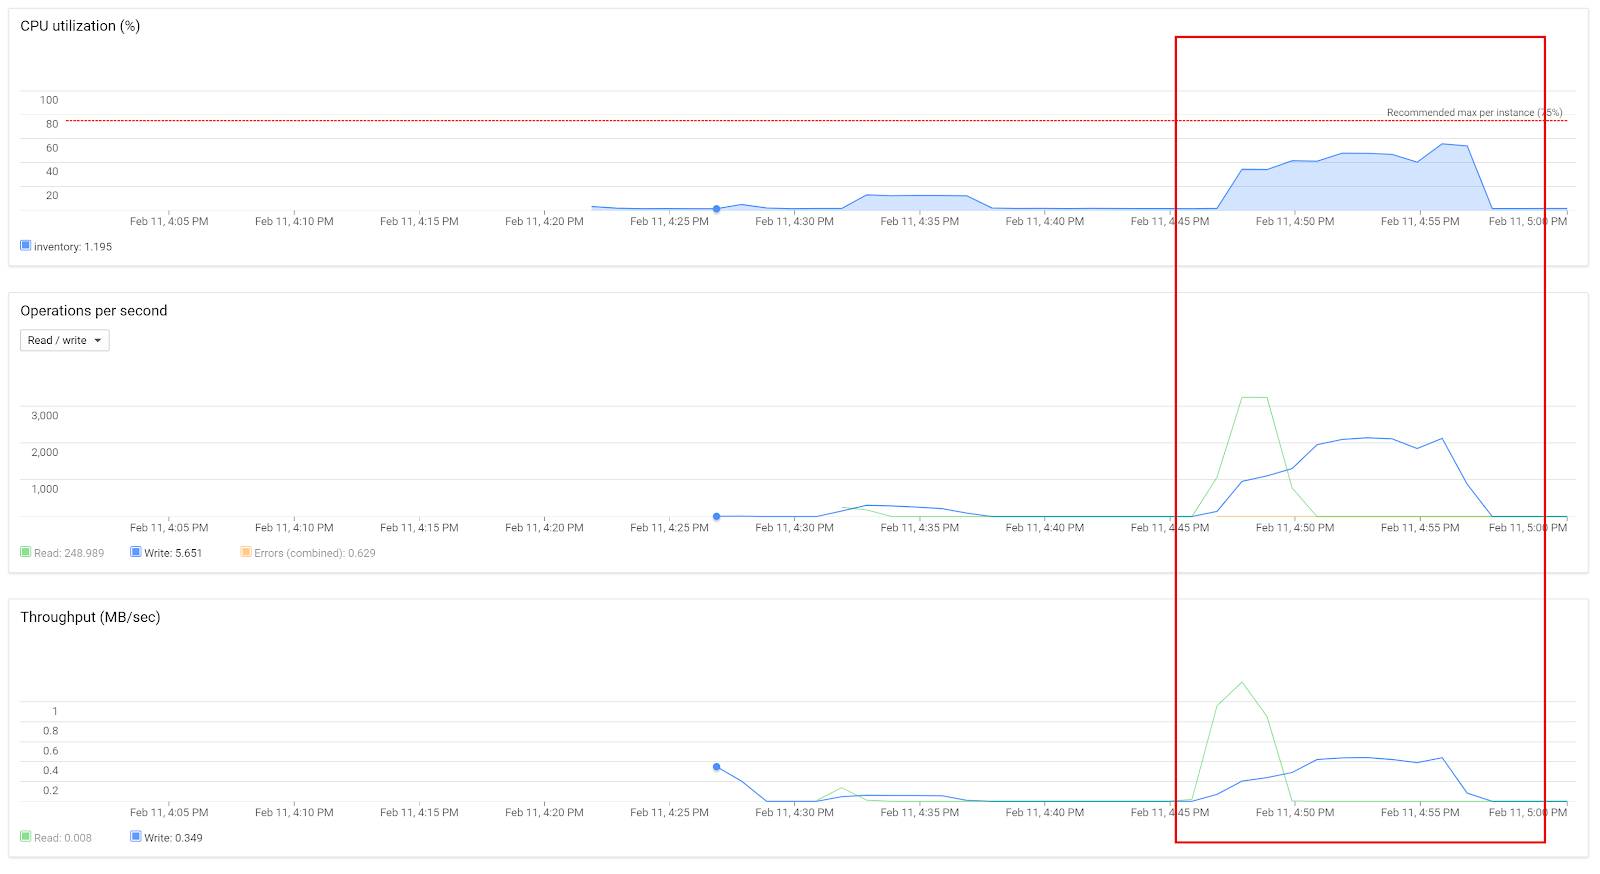
Cloud Spanner peak load tests with 50 concurrent threads showed high CPU loads (about 60%):
Sequential test
Parallel test
The multi-region test used this environment configuration:
| Inter-region calls | Cross-region calls | |
|---|---|---|
| Database | 3 nodes (nam3: primary us-east-4, secondary us-east-1) 1,000,000 items (100 stores, 10,000 SKUs) Cost: 3 x $3.00 per hour + $0.50 per GB/month |
|
| Application cluster | 1 x n1-standard-16 (us-east-4) | 1 x n1-standard-16 (us-east-1) |
| JMeter cluster | 1 x n1-standard-4 (us-east-4) | 1 x n1-standard-4 (us-east-1) |
| JMeter configuration | 10,000 loops per test case | |
The multi-region performance test results:
| Multi region (nam3) | ||||
|---|---|---|---|---|
| Sequential / us-east-1 (17 threads) |
Parallel / us-east-1 (17 threads) |
Sequential / us-east-4 (17 threads) |
Parallel / us-east-4 (17 threads) |
|
| Inventory quantity (read use-case) |
TPS: 886 Avg: 18.98 (10..151) p95: 20.00 |
TPS: 814 Avg: 20.70 (10..284) p95: 27.00 |
TPS: 3691 Avg: 4.43 (2..130) p95: 6.00 |
TPS: 1871 Avg: 8.86 (2..148) p95: 19.00 |
| Replenish items (write use-case) |
TPS: 223 Avg: 75.83 (36..1050) p95: 80.00 |
TPS: 220 Avg: 76.92 (36..1861) p95: 83.00 |
TPS: 454 Avg: 37.20 (8..1220) p95: 40.00 |
TPS: 423 Avg: 39.85 (9..1529) p95: 46.00 |
| Reserve items (conditional write use-case) |
TPS: 221 Avg: 76.66 (36..1073) p95: 79.00 |
TPS: 220 Avg: 76.88 (35..1663) p95: 83.00 |
TPS: 456 Avg: 36.92 (9..1367) p95: 40.00 |
TPS: 423 Avg: 39.84 (8..1717) p95: 45.00 |
The latency of writes with a multi-region database deployment, even within the same region, is over twice as high as for a single region cluster, while the cost of reads is expectedly almost the same. With the fallback case and cross-region calls, the latencies are doubled, which needs to be taken into account in the application SLA (service level agreement). While the overall read latency looks good, the write latency is rather high for our inventory management test case even in a single-region deployment.
Amazon DynamoDB evaluation
Amazon DynamoDB is a fully managed key-value and document database that supports multi-region, multi-master deployments with built-in security, backup and restore, and in-memory caching. Amazon does not publish an uptime SLA for the service. However, data is declared to be replicated across three different availability zones over the region. For a multi-region setup, Amazon offers the DynamoDB Global table, which can be used for geographically distributed applications as well as for failover in case of a primary region outage. This solution is significantly more expensive, as the price includes write capacity and data transfer for replicated data.
The DynamoDB resource provisioning model offers two options: provisioned and on-demand capacity modes. The provisioned model allocates read and write table capacity explicitly (it can be changed after creation), and configures auto-scaling policies to adjust the settings. The on-demand model simply pays for the actual amount of units consumed. The main trade-off of the on-demand model is a higher price per unit, which increases with the growing number of requests. However we have also noted delayed resource provisioning, so that response latency temporarily spikes when the load is increased.
Amazon DynamoDB is based on the wide-column data model, with flexible schema with various supported types for table attributes, including scalar types, documents (lists or maps) or scalar sets. DynamoDB provides JSON API for queries or DML operations, but does not support SQL, joins, aggregation or grouping.
The integration at the application level was implemented via a DynamoDB native Java driver (com.amazonaws:aws-java-sdk-dynamodb:1.11.462). For a single region configuration, we used transactions to make conditional and simple writes. Global table transactions (multi-region deployment) are not supported, so the implementation was changed to use optimistic locks based on document version.
Here's the single-region test environment configuration:
| Database | Single region us-east-1 1,000,000 items items (100 stores, 10,000 SKUs) Read capacity = 5000, write capacity = 5000 |
| Application cluster | 1 x m4.4xlarge (us-east-1e) |
| JMeter cluster | 1 x t2.xlarge (us-east-1e) |
| JMeter configuration | 10,000 loops per test case |
Here are the single-region services’ benchmarking results:
| Single region (us-east-1) | ||||
|---|---|---|---|---|
| Sequential (17 threads) |
Parallel (17 threads) |
Sequential (50 threads) |
Parallel (50 threads) |
|
| Inventory quantity (read use-case) |
TPS: 2885 Avg: 5.72 (3..225) p95: 9.00 |
TPS: 1503 Avg: 11.15 (3..1014) p95: 18.00 |
TPS: 6784 Avg: 7.17 (3..408) p95: 11.00 |
TPS: 2553 Avg: 18.52 (3..22654) p95: 11.00 |
| Replenish items (write use-case) |
TPS: 1486 Avg: 11.23 (7..739) p95: 15.00 |
TPS: 1111 Avg: 15.07 (7..464) p95: 16.00 |
TPS: 4008 Avg: 12.00 (7..1333) p95: 16.00 |
TPS: 1794 Avg: 26.63 (7..7427) p95: 14.00 |
| Reserve items (conditional write use-case) |
TPS: 1519 Avg: 11.02 (3..410) p95: 13.00 |
TPS: 1117 Avg: 15.05 (4..477) p95: 16.00 |
TPS: 4042 Avg: 11.90 (3..611) p95: 15.00 |
TPS: 1814 Avg: 26.56 (3..11733) p95: 15.00 |
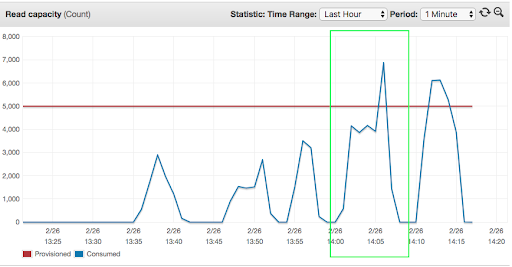
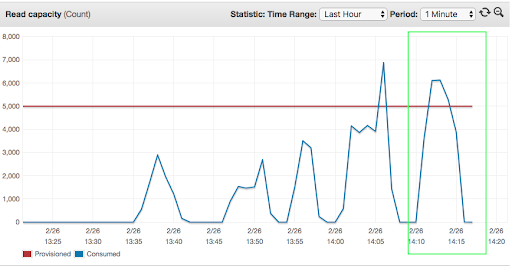
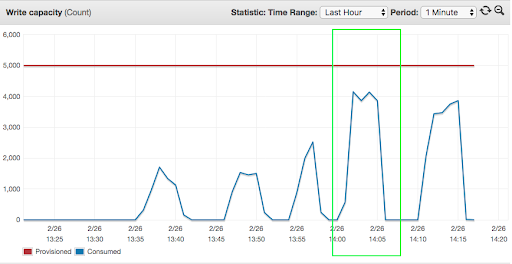
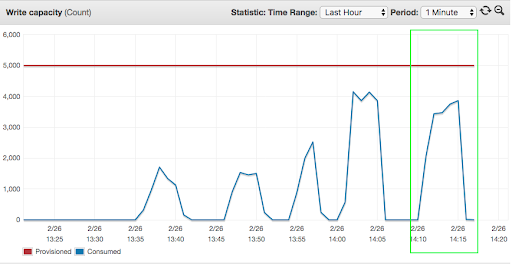
At the peak load with 50 concurrent threads, consumption of DynamoDB resources ran over the allocated capacity of 5000 units, which led to spikes in the number of throttled read/write requests. Consumption of “read capacity” was constantly equal or higher than “write capacity” due to version-based optimistic locking, which required reading the record to be modified.
The sequential read capacity test:
The parallel read capacity test:
The sequential write capacity test:
The parallel write capacity test:
For the multi-region test, we deployed a DynamoDB Global table in two regions: us-east-1 and us-east-2. The environment configuration was:
| Inter-region calls | Cross-region calls | |
|---|---|---|
| Database | Global table in us-east-1 with replica in us-east-2 1,000,000 items items (100 stores, 10,000 SKUs) Read capacity = 5000, write capacity = 5000 |
|
| Application cluster | 1 x m4.4xlarge (us-east-1) | 1 x m4.4xlarge (us-east-2) |
| JMeter cluster | 1 x t2.xlarge (us-east-1) | 1 x t2.xlarge (us-east-2) |
| JMeter configuration | 10,000 loops per test case | |
The benchmarking results are as follows:
| Multi region (global table us-east-1 / us-east-2) | ||||
|---|---|---|---|---|
| Sequential / us-east-1 (17 threads) |
Parallel / us-east-1 (17 threads) |
Sequential / us-east-2 (17 threads) |
Parallel / us-east-2 (17 threads) |
|
| Inventory quantity (read use-case) |
TPS: 2735 Avg: 6.08 (3..1008) p95: 8.00 |
TPS: 1524 Avg: 10.98 (4..238) p95: 18.00 |
TPS: 1067 Avg: 15.79 (14..195) p95: 18.00 |
TPS: 1023 Avg: 16.48 (14..228) p95: 19.00 |
| Replenish items (write use-case) |
TPS: 1543 Avg: 10.79 (7..315) p95: 13.00 |
TPS: 1076 Avg: 15.46 (7..1444) p95: 15.00 |
TPS: 516 Avg: 32.76 (29..725) p95: 37.00 |
TPS: 528 Avg: 31.99 (29..257) p95: 34.00 |
| Reserve items (conditional write use-case) |
TPS: 1553 Avg: 10.76 (4..383) p95: 13.00 |
TPS: 1088 Avg: 15.34 (4..1373) p95: 16.00 |
TPS: 523 Avg: 32.16 (14..3320) p95: 34.00 |
TPS: 529 Avg: 31.88 (14..1033) p95: 34.00 |
Since no server side transactions were used, we did not observe a difference in latencies between reads/writes in a single region table and the global table accessed from the primary region (i.e. us-east-1). However, in the case of cross-region calls, which mimic a primary region outage with a failover scenario, the latency of write cases doubled, while read case latency tripled.
Overall, DynamoDB demonstrated read performance good enough for the inventory service, very close to the performance of Google Cloud Spanner. The write latencies were significantly lower than the Google Cloud Spanner implementation, but this is a consequence of using optimistic version-based locking versus server-side transactions.
Azure Cosmos DB evaluation
Azure Cosmos DB is a globally distributed, multi-model database service, which allows elastically and independently scaling throughput and storage across multiple geographic regions. Cosmos DB provides comprehensive service level agreements for throughput, latency, availability, and consistency guarantees, not just uptime. The database can be deployed in a single region (with service availability of 99.99%) or in a multi-region setup with multiple or single write regions (wth service availability increased to 99.999% for reads/writes or reads only).
The cost of all database operations is normalized by Azure Cosmos DB, and is expressed by Request Units (RUs). It abstracts system resources such as CPU, IOPS and memory that are required to perform the database operations. Cosmos DB does not support the auto-scaling of resource allocation, so one must explicitly specify the amount of provisioned request units. If the consumed Request Units run out of the allocated capacity, the service will start throttling requests. Throughput provisioning can be made at the container or database (which is a set of containers) level. The main difference is that database throughput provisioning is generally cheaper, but does not guarantee resource availability for a particular container.
Azure Cosmos DB, which was initially launched as a document database, has been extended to support SQL API, MongoDB and Cassandra APIs compatible with native drivers at the wire protocol level, Table API and Gremlin. The API is defined at the container level at creation time and cannot be changed on the fly, so the same data cannot be accessed through multiple APIs.
The integration at the application level was implemented through the Document API via the Spring Data repository (com.microsoft.azure:spring-data-cosmosdb:2.1.0). The data load functionality was implemented on Cosmos DB native bulk executor, which is more efficient than regular writes for batches. Document updates were implemented using an Optimistic Concurrency Control (OCC) pattern based on document “_etag”.
As with the previously discussed database services, we ran Azure Cosmos DB benchmark tests for different deployments: single region, two regions with the primary one colocated with application, and the failover scenario when the application connects to the database in a different region. The environment was deployed in the West Europe region, with the database either in the same region with or without failover in the North Europe region. To mimic the failover scenario, the primary write instance of the database was in the North Europe region.
| Database | West Europe / North Europe 1,000,000 items items (100 stores, 10,000 SKUs) 100,000 RU/s per container, 1000 logical partitions(17 physical partitions), Bounded Staleness consistency level, Document database Cost: $8.00 per hour + storage for a single region $16.00 per hour + storage + traffic for two regions |
| Application cluster | 1 x Standard_F4s_v2 (West Europe) |
| JMeter cluster | 1 x Standard_E2s_v3 (West Europe) |
| JMeter configuration | 17 (50) threads; 10,000 loops per test case |
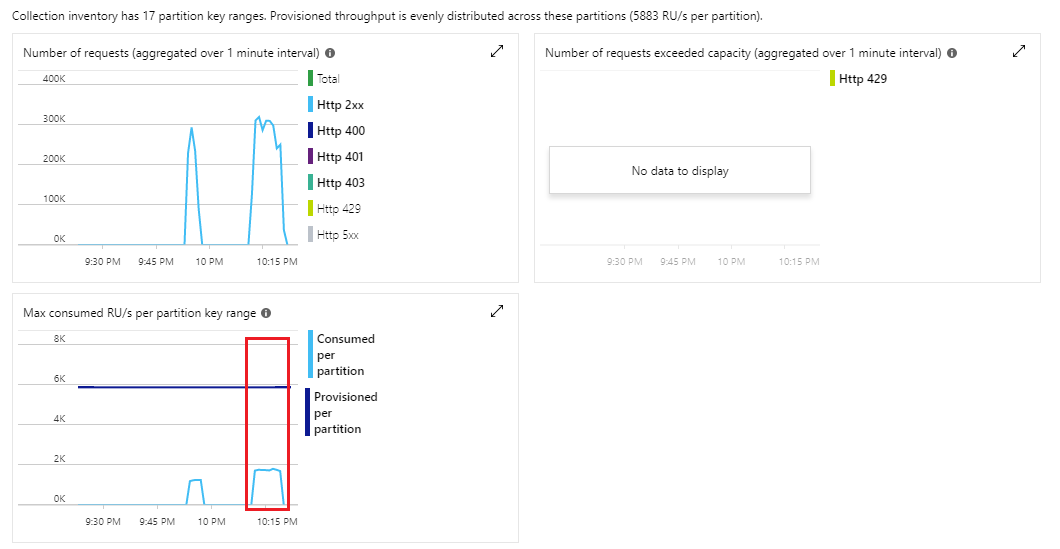
In our tests, we allocated 100,000 RUs/sec for data sharded into 1000 logical partitions (based on a synthetics partition key). Logical partitions are, in turn, distributed among physical partitions, which are automatically allocated by the database engine. The problem is that the number of physical partitions has a direct effect on database performance, because provisioned throughput is evenly distributed between them. So, if the load is unevenly distributed between logical partitions, the result would be spikes in load on certain physical partitions, which can be throttled even if the overall throughput capacity at the container level is sufficient. It is important to select the partitioning key not only with respect to proportional splitting of the dataset, but also with regard to the future load profile.
Here are the results of benchmark tests that simulated regular and peak load on the inventory services in the single region West Europe:
| Single region (West Europe) | ||||
|---|---|---|---|---|
| Sequential (17 threads) |
Parallel (17 threads) |
Sequential (50 threads) |
Parallel (50 threads) |
|
| Inventory quantity (read use-case) |
TPS: 1686 Avg: 9.74 (7..1074) p95: 12.00 |
TPS: 1383 Avg: 11.91 (7..1027) p95: 14.00 |
TPS: 4134 Avg: 11.70 (7..1113) p95: 14.00 |
TPS: 1545 Avg: 31.40 (8..1173) p95: 49.00 |
| Replenish items (write use-case) |
TPS: 941 Avg: 17.74 (13..1121) p95: 20.00 |
TPS: 851 Avg: 19.52 (14..1122) p95: 21.00 |
TPS: 2496 Avg: 19.46 (14..1132) p95: 22.00 |
TPS: 1435 Avg: 34.11 (14..1139) p95: 32.00 |
| Reserve items (conditional write use-case) |
TPS: 925 Avg: 18.03 (7..1165) p95: 20.00 |
TPS: 847 Avg: 19.57 (8..1123) p95: 21.00 |
TPS: 2516 Avg: 19.35 (8..1146) p95: 23.00 |
TPS: 1419 Avg: 34.59 (8..1230) p95: 28.00 |
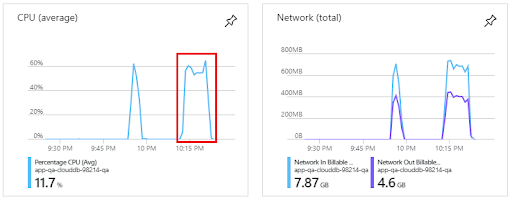
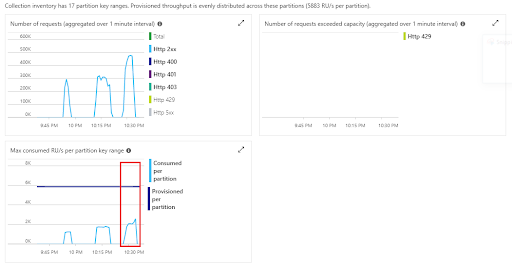
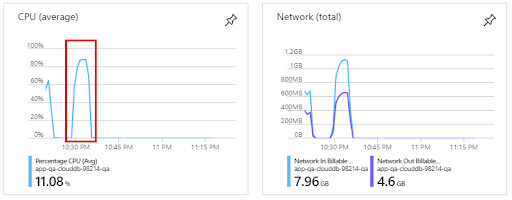
The tests did not face a bottleneck on the database side. However, under the stress parallel load of 50 threads per test, the application server reached the CPU capacity of 16 cores:
The sequential stress load test - Azure Cosmos DB:
The sequential stress load test - Application server:
The parallel stress load test - Azure Cosmos DB:
The parallel stress load test - Application server:
The multi-region database setup observed these benchmark results:
| Multi-region (West Europe / North Europe) | ||||
|---|---|---|---|---|
| Sequential / West Europe (17 threads) |
Parallel / West Europe (17 threads) |
Sequential / North Europe (17 threads) |
Parallel / North Europe (17 threads) |
|
| Inventory quantity (read use-case) |
TPS: 1732 Avg: 9.45 (7..957) p95: 11.00 |
TPS: 1465 Avg: 11.32 (7..1024) p95: 14.00 |
TPS: 588 Avg: 28.34 (23..1345) p95: 30.00 |
TPS: 572 Avg: 28.99 (23..2073) p95: 31.00 |
| Replenish items (write use-case) |
TPS: 914 Avg: 18.12 (14..1278) p95: 21.00 |
TPS: 861 Avg: 19.29 (14..1112) p95: 23.00 |
TPS: 306 Avg: 55.01 (46..1408) p95: 58.00 |
TPS: 303 Avg: 55.39 (46..1372) p95: 59.00 |
| Reserve items (conditional write use-case) |
TPS: 896 Avg: 18.61 (7..1076) p95: 21.00 |
TPS: 861 Avg: 19.34 (7..1140) p95: 23.00 |
TPS: 308 Avg: 54.82 (24..1354) p95: 58.00 |
TPS: 303 Avg: 55.27 (24..1397) p95: 59.00 |
The performance of the multi-region database with the application running in the same region is almost the same as for a single region deployment. This is the result of using the “bounded staleness” consistency level, which provides “strong consistency” guarantees for reads within the region of writes, and enables cross region consistency outside of the staleness window. In the case of failover and cross-region calls from the application to the database, the service latency is almost 3 times higher, which is also observed for database services from other cloud providers.
An important question in designing an Azure Cosmos DB solution is estimating the provisioned throughput capacity. In our tests, we came up to 100,000 RUs/sec, but the greater the allocation, the higher the service cost. For example, 100,000 RUs/sec of provisioned capacity is estimated to cost $5,840 for a single region database, or $11,680 to add one more write region. Azure Cosmos DB has a database capacity planner to estimate the database throughput which needs to be provisioned. We compared the number obtained from the calculator with the actual observed throughput consumption. For the exercise, we took the throughput results from the parallel stress load test (50 thread per use case in a single region) and uploaded a sample document:

The calculator’s estimated throughput of 34,200 RU/s calculated value is very close to the observed value. Using the database throughput chart from this benchmark, the consumed throughput per partition is a little over 2,000 RUs/sec. Taking into account that the data was split into 17 physical partitions, 34,000 RUs/sec were actually consumed.
What if we use smaller provisioned throughput? We made similar tests with 20,000 RU/s and compared the results:
| Multi-region (West Europe / North Europe) | ||||
|---|---|---|---|---|
| Sequential / West Europe (17 threads) |
Parallel / West Europe (17 threads) |
|||
| No request throttling (100K RU/s) |
Request throttling (20K RU/s) |
No request throttling (100K RU/s) |
Request throttling (20K RU/s) |
|
| Inventory quantity (read use-case) |
TPS: 1732 Avg: 9.45 (7..957) p95: 11.00 |
TPS: 1489 Avg: 11.17 (8..438) p95: 14.00 |
TPS: 1465 Avg: 11.32 (7..1024) p95: 14.00 |
TPS: 1128 Avg: 14.62 (9..909) p95: 14.00 |
| Replenish items (write use-case) |
TPS: 914 Avg: 18.12 (14..1278) p95: 21.00 |
TPS: 437 Avg: 38.60 (17..70177) p95: 27.00 |
TPS: 861 Avg: 19.29 (14..1112) p95: 23.00 |
TPS: 447.08 Avg: 37.26 (17..55134) p95: 32.00 |
| Reserve items (conditional write use-case) |
TPS: 896 Avg: 18.61 (7..1076) p95: 21.00 |
TPS: 448 Avg: 37.71 (9..155402) p95: 27.00 |
TPS: 861 Avg: 19.34 (7..1140) p95: 23.00 |
TPS: 446 Avg: 37.30 (9..55132) p95: 32.00 |
The throughput for each case gets significantly lower, almost doubling latency. Does this mean that fewer allocated RUs/sec lead to poorer database performance? No. The problem is in the request throttling, which is observed on the database monitoring charts:
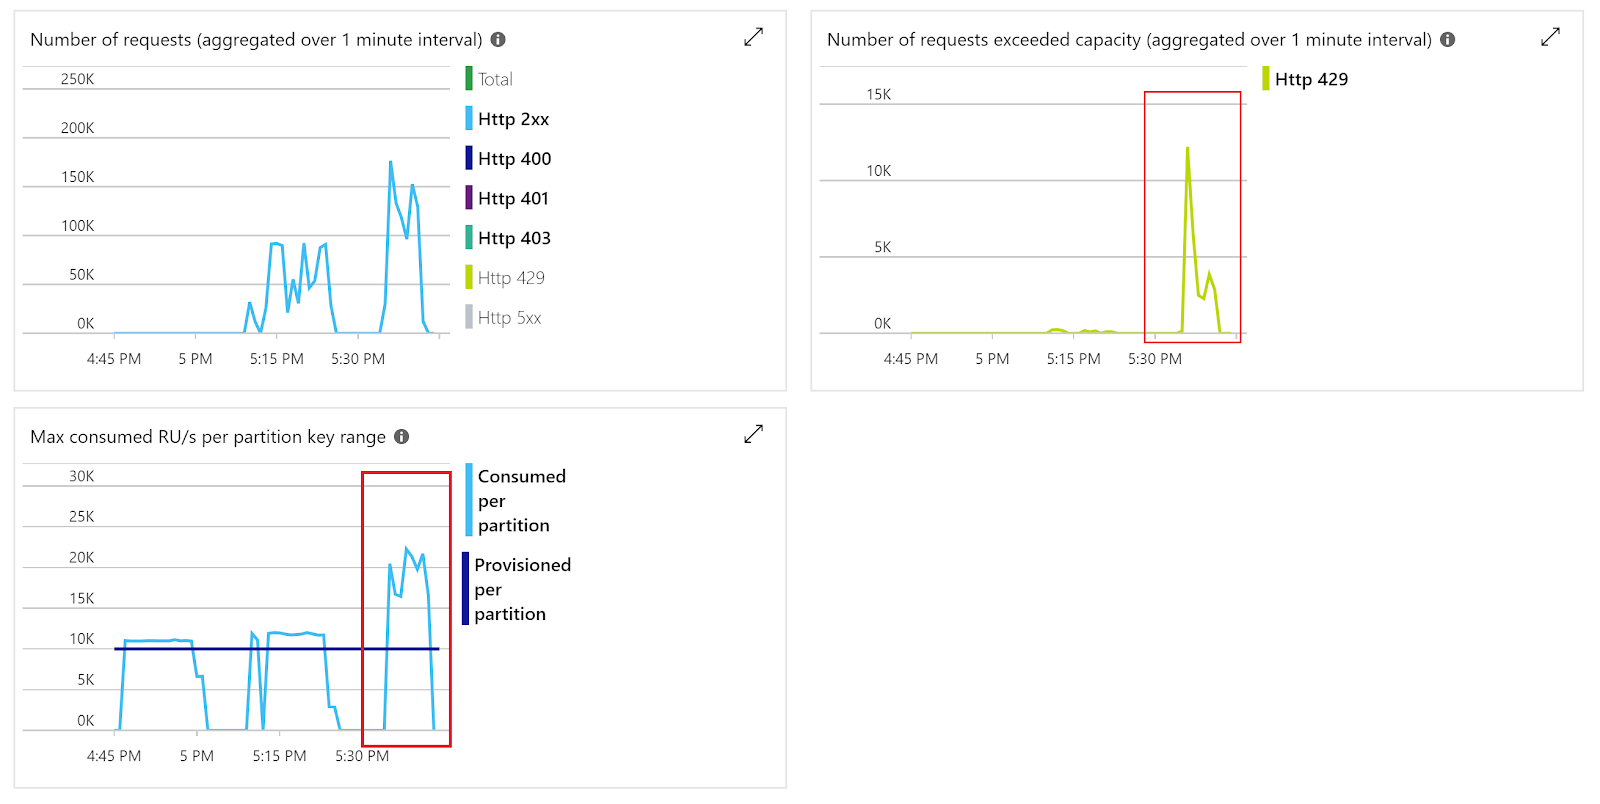
Throttled requests result in an error response from the database service with a recommended delay in milliseconds before retrying the query. This routing is screened from the developer by the Cosmos DB client library. Insufficiently provisioned throughput with the inventory service level can affect the service SLA, and should be properly handled.
To conclude the Azure Cosmos DB evaluation, the inventory service performance was comparable to the Google Cloud Spanner in writes and worse for read cases. On the other hand, Cosmos DB provides capacity planning, monitoring and diagnostic tools, which help to troubleshoot issues.
Summary
To summarize the sequential load profile in a single region deployment:
| Comparison of single-region benchmark results (sequential, 17 threads) | |||
|---|---|---|---|
| Google Cloud Spanner | Amazon DynamoDB | Azure Cosmos DB | |
| Inventory quantity (read use-case) |
TPS: 3010 Avg: 5.46 (3..145) p95: 7.00 |
TPS: 2885 Avg: 5.72 (3..225) p95: 9.00 |
TPS: 1686 Avg: 9.74 (7..1074) p95: 12.00 |
| Replenish items (write use-case) |
TPS: 1012 Avg: 16.6 (10..167) p95: 19.00 |
TPS: 1486 Avg: 11.23 (7..739) p95: 15.00 |
TPS: 941 Avg: 17.74 (13..1121) p95: 20.00 |
| Reserve items (conditional write use-case) |
TPS: 914 Avg: 18.41 (9..204) p95: 21.00 |
TPS: 1519 Avg: 11.02 (3..410) p95: 13.00 |
TTPS: 925 Avg: 18.03 (7..1165) p95: 20.00 |
The comparison table shows that the performance of the implemented cases under high load is good, and is sufficient for a typical retail inventory service. Lastly, we looked at the provisioning and pricing model cloud services. This gives an idea of the basic database costs provisioned for this research:
| Google Cloud Spanner | Amazon DynamoDB | Azure Cosmos DB | |
|---|---|---|---|
| Resource provisioning model | Database instances | Provisioned or on-demand capacity specified for read and write operations separately. | Request units per second (RUs/sec) |
| Pricing model for provisioned capacity (without storage, traffic and maintenance costs) | Single region (us-east-1): $0.90/hour per instance Multi-region (nam3): $3.00/hour per instance |
Single region (us-east-1): $65.00/hour for 100K write capacity units $13.00/hour for 100K read capacity units Multi region (us-east-1 / us-east-2): $97.50/hour for 100K replicated write capacity units $13.00/hour for 100K read capacity units |
$8.00/hour for 100K RU/s per region (West Europe / North Europe) |
| Cost of the provisioned capacity for the databases used in the single-region benchmarks | $2.70/hour (3 instances) | $3.90/hour (5,000 read request units and 5,000 write request units) | $8.00/hour (100,000 RU/s) |
Enterprise companies currently using a custom database deployment on the cloud (Platform as a Service or PaaS) solution should consider a DBaaS. All three of the tested DBaaS products are capable of meeting the maximum load requirements of a typical retail inventory management system. A company implementing DBaaS should note that each product varies in operational details. These differences can be useful to fine-tune the SLA with the company's cloud provider.
Full service providers of DBaaS have built up an impressive array of features offering scalable multi-region databases that are suitable for inventory management services from the performance and functional perspective. We hope this article gives you some insight into making a more informed decision.
